
The vision behind LabChart Lightning: Flexible analysis tools and calculations.
The idea for producing such an innovative, new piece of software like LabChart Lightning stemmed from two major trends that seen within the scientific community.
Firstly, research is diversifying, rapidly. ADInstrument’s experience with customers has shown that as time goes on, there is more and more diversity in the type of questions scientists are trying to answer, and as a result, researchers are looking for greater flexibility within the tools that they use, for both sampling and analyzing their data.
Paired with this, the number of new digital devices that people want to sample from and integrate into their existing systems is expanding.
As a result of these converging trends, researchers are often forced to create their own workarounds, by sampling data into multiple pieces of software and then creating their own complex analysis tools in programs like Python or R.
The problem with science moving in this direction, however, is that research is becoming more specialized and siloed. Generally, the people who are able to create these custom tools for themselves end up working in smaller groups, and the people outside of these groups can’t replicate what they’ve been doing, because the tools are custom made.
With LabChart Lightning, we wanted to address these issues by creating a software platform that gives people greater flexibility around the devices they can connect to, as well as providing a platform for customers to create customized analysis tools that meet their specific needs.
Enhanced user experience
When you open LabChart Lightning for the first time, one thing you’ll immediately notice is the clean, modern user interface (UI). The redesigned the UI to be more user friendly and intuitive, employing drag and drop technology across many of the features, such as the overlaying of signals within a single channel.
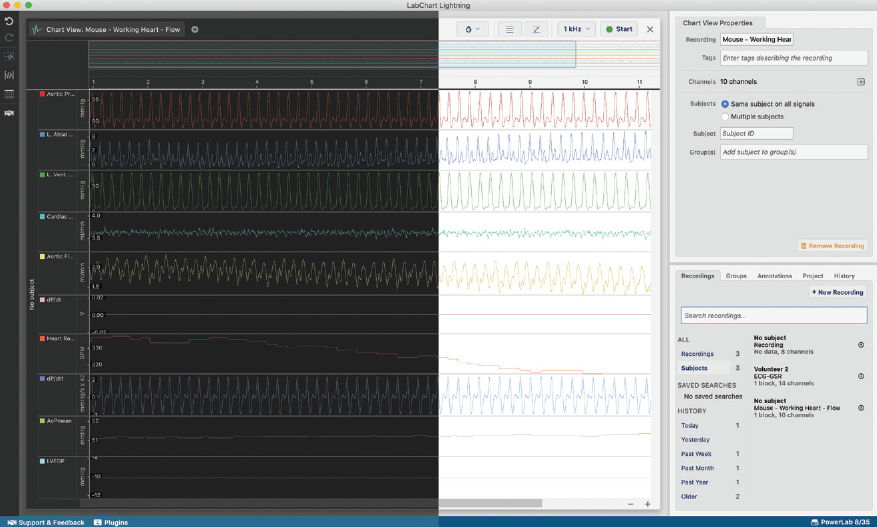
PLUS the addition of the ability to change the theme from light to dark mode, which is particularly useful for those who spend long periods of time in front of their data.
However, it’s not just the visual aspects of the software that have changed. A lot of work around improving the in-lab experience for customers. This extends from the more simplistic side of how we’ve laid out the signals and channels in Chart View, to designing a JavaScript Software Development Kit (SDK) for integrating digital devices.
Improved data management and cross-recording analysis
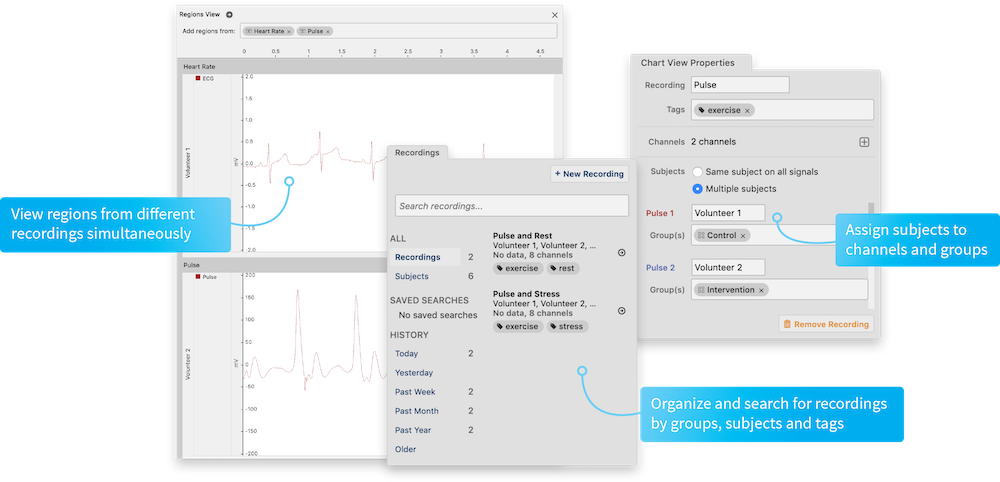
Another major difference is in the software architecture. In LabChart 8, each of your experimental sessions were saved in discrete data files, which required the user to export data from a single subject and try to match that data in another software, with the rest of the data from their experiment.
In LIGHTNING, a new data management structure has been created. One in which allows you to have all of the recordings from a single experiment, inside a single project. Features inside Lightning, like regions and the table view can operate across the entire project, allowing you to take steps in your analysis that work across all of your recordings.
Third-party device integration
As mentioned above, we have designed a JavaScript SDK for integrating third-party digital devices directly into LabChart Lightning, independent of a PowerLab. This means you can now create your own Javascript plugins (using GitHub) and sample data from non-ADInstruments devices directly into the software.
For more information on how to integrate third-party devices and create your own plugins, check out our Lightning Device SDK page »
Inspiring creativity and collaboration
The CUSTOM CALCULATION TOOL is ADInstruments’ solution for simplifying hard and more complex calculations or workflows by making building blocks so that researchers can create their own calculations and workflows (like our analysis modules), that they can later modify to fit their experimental needs.
The special part about re-creating these calculations in Lightning, is that it’s relatively easy to go back to the original arithmetic and make modifications to the channel inputs or variables to fit your experimental needs.
LIGHTNING offers the users the option to export and share their workflows and specialized calculations with other researchers around the world – opening new doors for collaboration and the sharing of ideas across many specialized areas of research.
Don’t have LabChart Lightning? No worries, you can sign up for a 30-day free trial below »
